Our Global Population Model

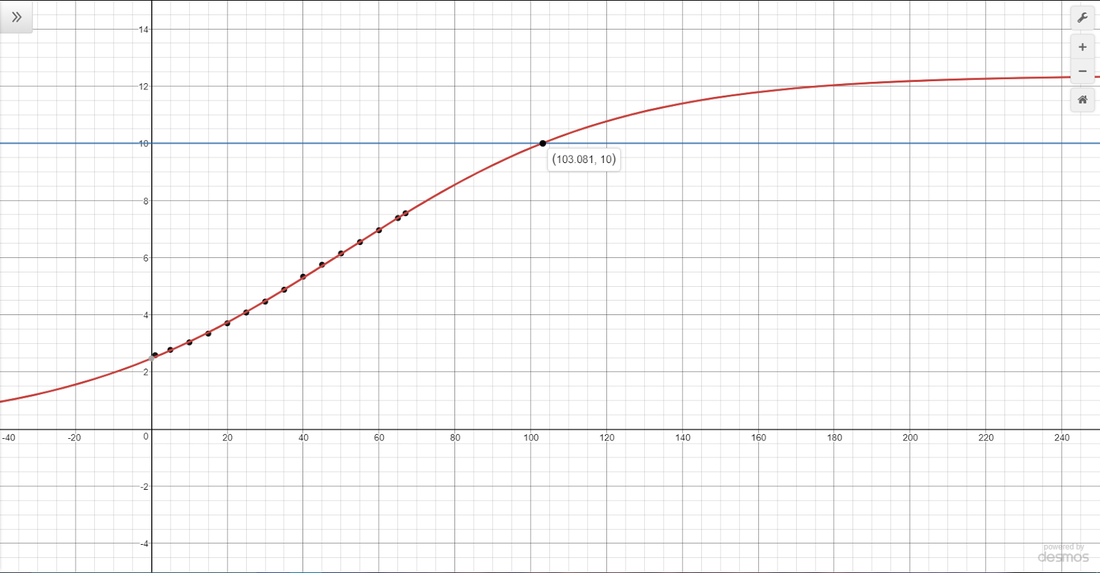
To create our population model, we took the data points seen on the left and created a logarithmic regression from them. The x value is years since 1950, and the y₁ values are billions of people. We chose a logarithmic regression because all populations have a carrying capacity, which is represented by the constant k in a logarithmic function.
Equation: y = (12.378) / (1 + 4.102e^-0.0274x)
r² = 0.9997
Carrying Capacity (k) = 12.378 billion people
Our projection will intersect with 10 billion people at x = 103.081 or 2053 CE. This is the carrying capacity accepted by many scientists.
Equation: y = (12.378) / (1 + 4.102e^-0.0274x)
r² = 0.9997
Carrying Capacity (k) = 12.378 billion people
Our projection will intersect with 10 billion people at x = 103.081 or 2053 CE. This is the carrying capacity accepted by many scientists.
Our group decided to take a look at different portions of the global population. We divided the population into three age groups: 0-14, 15-64, and 65+, which correspond to a general working age from 15-64. The X values are years past 1950 while the Y values are millions of people rounded to the nearest million.

We then graphed this data below, without the working class age (15-64).
The blue line represents the 0-14 age group.
Equation: y = (1978.29) / (1 + 1.309e^-0.0559x)
r² = 0.9966
The black line represents the 65+ age group.
Equation: y = (8084.195) / (1 + 79.47e^-.02897x)
r² = 0.9966
The green line represents the global population, as projected above.
The blue line represents the 0-14 age group.
Equation: y = (1978.29) / (1 + 1.309e^-0.0559x)
r² = 0.9966
The black line represents the 65+ age group.
Equation: y = (8084.195) / (1 + 79.47e^-.02897x)
r² = 0.9966
The green line represents the global population, as projected above.
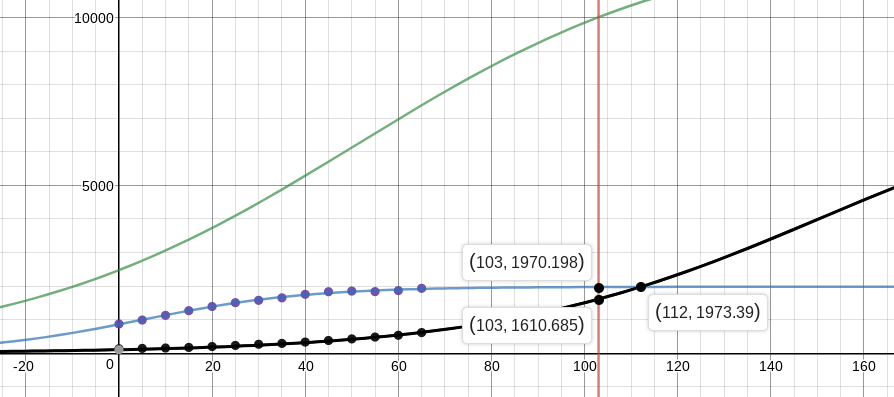
We can observe that, when the global population (the green line) reaches 10 billion in 2053 there will be a projected 1.970 billion people ages 0-14 and 1.610 billion people ages 65+. We also see that the population for people ages 65+ exceeds that of the younger group at the point (122, 1973.39). This means that in 2072, there will be more people older than 65 than people under the age of 14. The data for the working age population, added in red below, was rather interesting.
Equation: y = (13297.4) / (1 + 8.278e^-0.0243x)
r² = 0.9977
Equation: y = (13297.4) / (1 + 8.278e^-0.0243x)
r² = 0.9977
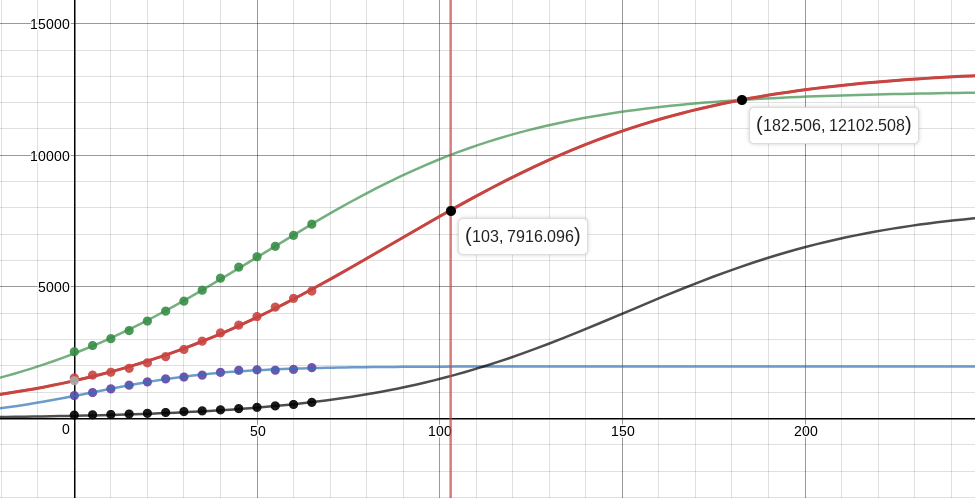
One notable point of interest is at (103, 7916.096) where the working class age group will be when the global population is at 10 billion people (our carrying capacity). An interesting point of intersection is at (182.506, 12102.508) where the projection of the working class exceeds the projected global population. The predicted “carrying capacity” of this age group is almost 13.3 billion people. This conflicts with our global population projection, which places the total population at a carrying capacity of ~12.4 billion. From this data, we can conclude that the global population is generally increasing in age, but the working-aged population, which the rest of the population depends upon, forms the bulk of the numbers. At 2062, we predict that there will be more people aged 65 and higher than there will be people under the age of 15. The following graph shows this:

The overall trend of the global median age since 1970 is one of gradual increase. This could be due to increased health care, reduced mortality rates, as well as other resources that extend the longevity of people’s lives. Although this could be considered a good thing, there are consequences as well. According to Investopedia.com, people aged 65 and older currently make up 20% of the population in Italy, Germany, and Japan, and the number of countries is estimated to reach 13 by 2020. An older population means that countries will have to spend more of their GDP on health care, as older age generally makes people more vulnerable to disease. In addition, in countries where the population consists of a higher percentage of older people, there will be lesser numbers of workers who can be taxed to support the higher health costs, as well as personal benefits like pensions.
In conclusion, the average global citizen is getting older and older. This will force more countries to spend more on health care. This will also result in a declining middle class, which provides the world with a strong work force and drives the economy. With a smaller working class, economies will weaken and fall.
In conclusion, the average global citizen is getting older and older. This will force more countries to spend more on health care. This will also result in a declining middle class, which provides the world with a strong work force and drives the economy. With a smaller working class, economies will weaken and fall.
Sources:
https://www.populationpyramid.net/hnp/age-dependency-ratio-of-working-age-population/2015/ http://www.un.org/en/sections/issues-depth/population/index.html http://www.investopedia.com/articles/investing/011216/4-global-economic-issues-aging-population.asp
https://www.indexmundi.com/g/r.aspx?t=0&v=25&l=en
https://esa.un.org/unpd/wpp/DataQuery/
