Our Model
We obtained our model through a logistic regression of population data points from 1965 to 2014. These points came from the Total Population - Both Sexes spreadsheet on the UN DESA Population division website (source 1). We decided to use a logistic regression because it fit our data much more closely than any exponential regression we tried. We concluded that population growth may already be slowing down, and has definitely not increasing at an exponential rate recently.
Note: The scale on the graph below has been adjusted to better represent the data, while the model stated gives population in millions for years after 1950.
Note: The scale on the graph below has been adjusted to better represent the data, while the model stated gives population in millions for years after 1950.
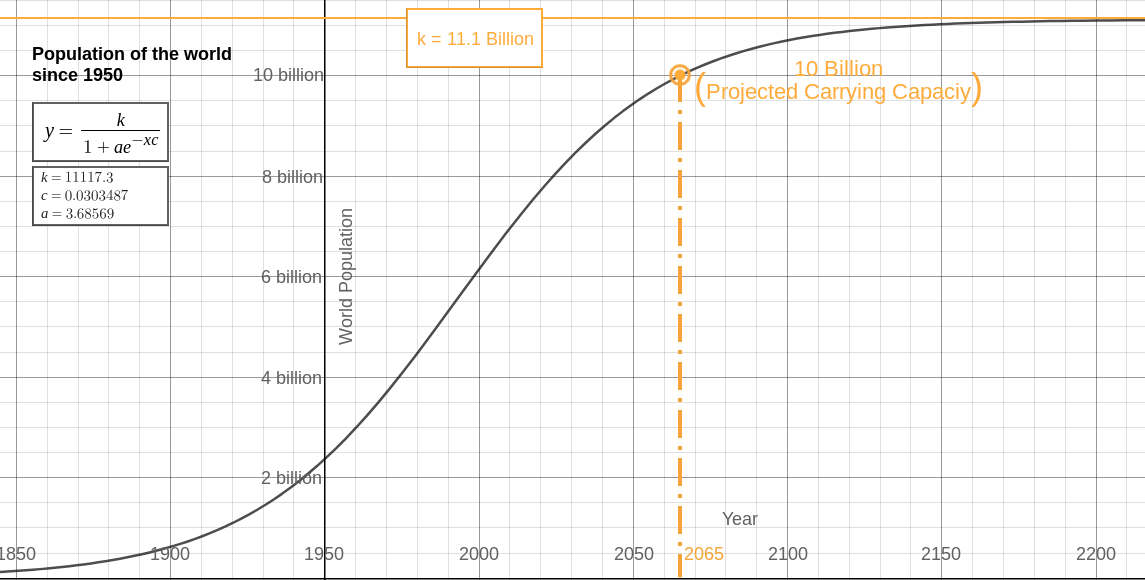
We selected 10 billion as the carrying capacity for our research, because it seems to be the most widely accepted value in the scientific community. Of course, estimates vary very widely from study to study, but the value most consistently reported appears to be 10 billion or close to it. 10 billion also seems to be the approximate midpoint of other frequent predictions. We had some trouble tracking down the source of that figure, but eventually identified it as E. O Wilson, a well known myrmecologist who applies his research with ant populations to human population growth.
Using the carrying capacity of 10 billion and our logistic model, we found that the human population will reach carrying capacity in about 2065.
What does this mean?
Does this mean that at 12:01 on January 1st, 2065, there are suddenly massive food shortages and human civilization collapses into chaos? Of course not.
First of all, there is no way our model could ever predict events down to the day. We knew this, and rounded our date to the nearest year. In fact even that may be off by a few years, since it is very unlikely that population growth will continue to follow a perfect logistic curve. Perhaps some plague or natural disaster will severely dent our population. These are things that our model can not account for. LiIkewise, who knows how technological advancements may affect our carrying capacity. Food production is one industry in which researchers are searching for better methods all the time, and food is a significant factor in carrying capacity. However, if we continue roughly following the course we are on, we will hit our carrying capacity around 2065.
So what does happen when we hit it? Initially, nothing. We just keep on reproducing and the population keeps on growing. But in the background, after a little while and perhaps not immediately obvious to most, food production struggles to keep up. As people multiply, space dwindles, forcing us to choose between living in cramped and crowded conditions or expanding into the forests and natural areas we currently work so hard to protect. Eventually, quality of life drops significantly for most people, access to food and fresh water dwindles, and many begin to die. This continues until the population drops well below carrying capacity, humans regain their footing, and population begins to climb once again, moving past carrying capacity and restarting the cycle. After a few large cycles like this, the population stabilizes around 10 billion, still cycling, but no longer on a cataclysmic scale.
Project Meta-Survey
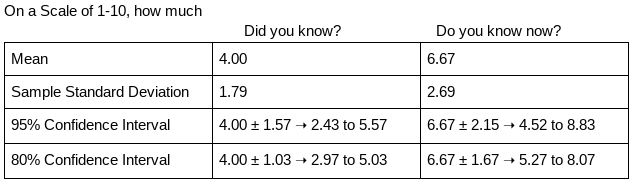
This survey had an underwhelming number of responses, but from what we have, we can see that the mean for the second question was higher than the first. Finding the standard deviation shows how untrustworthy the answers are due to a lack of data. Next we find that we are 80% sure that the the actual means aren’t reversed or close enough to be meaningless, so we can be reasonably certain that people felt that they better understood overpopulation.
This is interesting when compared to the frequently cited Dunning-Kruger effect, which effectively states that people who know very little about a subject feel disproportionately more confident of their knowledge. Since this study happened early in the research process, it is likely that this finding relates to the first peak, not the later gradual climb.
This is interesting when compared to the frequently cited Dunning-Kruger effect, which effectively states that people who know very little about a subject feel disproportionately more confident of their knowledge. Since this study happened early in the research process, it is likely that this finding relates to the first peak, not the later gradual climb.
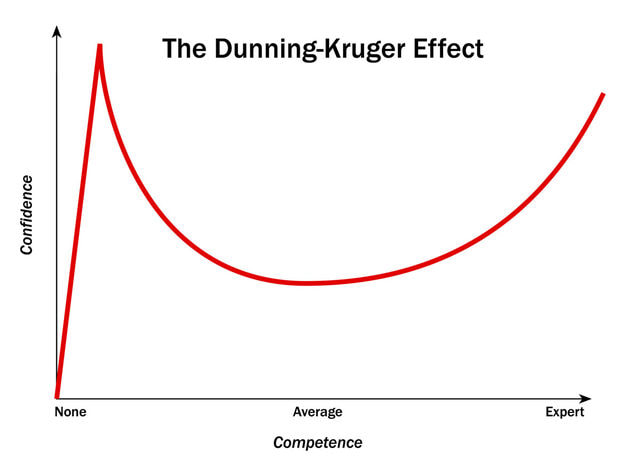
Another survey will have one of two results, either people feel more comfortable with the basics, meaning their perceived knowledge approaches the peak, or they have more questions and descend down to the concave part of the graph. The results of survey are now below.
Combining the information for the beginning parts of each study
Mean 4.8, sample standard deviation = 1.43, 95% 3.47 to 5.33, 99% 3.2 to 5.6, 80% 3.79 to 5.01
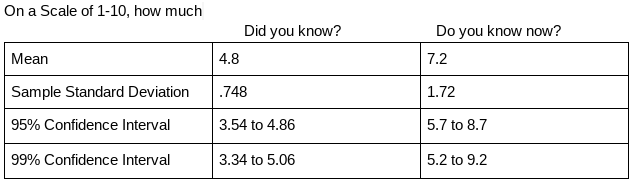
Again, this survey had an unfortunately low number of responses. However, the data suggests a slight increase in how much people feel like they knew from weeks two to four. This is concurrent with predictions, as most of our learning about population growth happened in the first two weeks. However, there really isn’t enough data to be sure that this is the case.
Using the combined initial data and the final data, there’s an approximately 90% chance that there was an increase in how much people felt like they knew about population growth. This is a more significant result than the 80% confidence interval from the beginning and second weeks.
One other significant result is a confidence interval of 99% resulting in no overlap for initial (not combined) and final. This gives a strong impression that people did actually learn from this project.
In summary, while these surveys weren’t as successful as we hoped, there was a clear trend of feeling like we learned more throughout the entire project.
Thanks to all those who participated!
Mean 4.8, sample standard deviation = 1.43, 95% 3.47 to 5.33, 99% 3.2 to 5.6, 80% 3.79 to 5.01
Again, this survey had an unfortunately low number of responses. However, the data suggests a slight increase in how much people feel like they knew from weeks two to four. This is concurrent with predictions, as most of our learning about population growth happened in the first two weeks. However, there really isn’t enough data to be sure that this is the case.
Using the combined initial data and the final data, there’s an approximately 90% chance that there was an increase in how much people felt like they knew about population growth. This is a more significant result than the 80% confidence interval from the beginning and second weeks.
One other significant result is a confidence interval of 99% resulting in no overlap for initial (not combined) and final. This gives a strong impression that people did actually learn from this project.
In summary, while these surveys weren’t as successful as we hoped, there was a clear trend of feeling like we learned more throughout the entire project.
Thanks to all those who participated!
Our Sources of Data:
- The United Nations Department of Economic and Social Affairs Population Division: World Population Prospects 2017
- This Official UN page contains a wealth of information, including spreadsheets of population data in many different forms (here). Each spreadsheet contains the data organized by many different factors, including separated by continent, region, and country.
