Data Analysis - GDP vs Population Growth
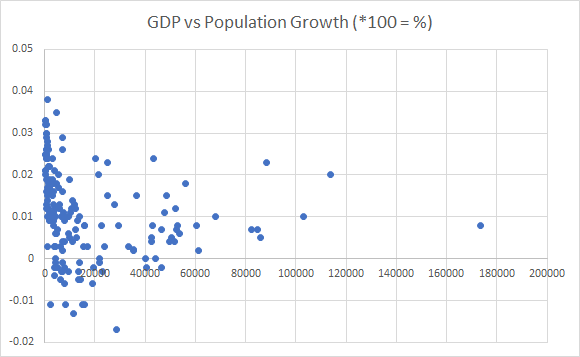
After gathering and looking at the data to start formatting it for excel, it became immediately apparent that there was some sort of pattern in the data, that being that countries with higher GDPs tend to have a lower birth rate than those with lower GDPs. This could sort of be seen with the initial scatter plot, however the trend was not immediately obvious. After a quick regression in excel, the r value was unacceptably low, so the data would have to be changed to be more representative of the real pattern here.
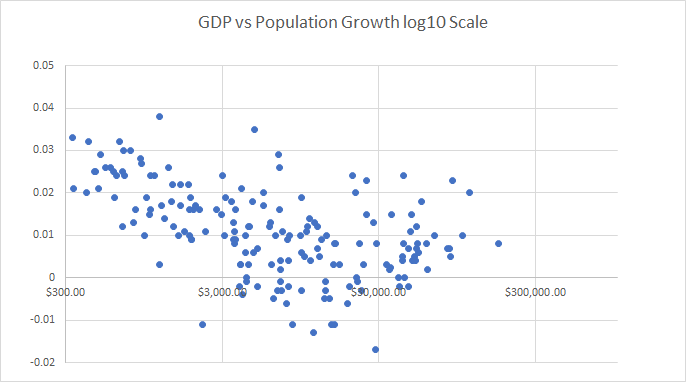
After taking the log of the GDP of all the countries, the pattern becomes even more clear. And with an r value of around .5199, it could have been accepted as the proper data to use to create a model, as can be seen with the scatter plot below
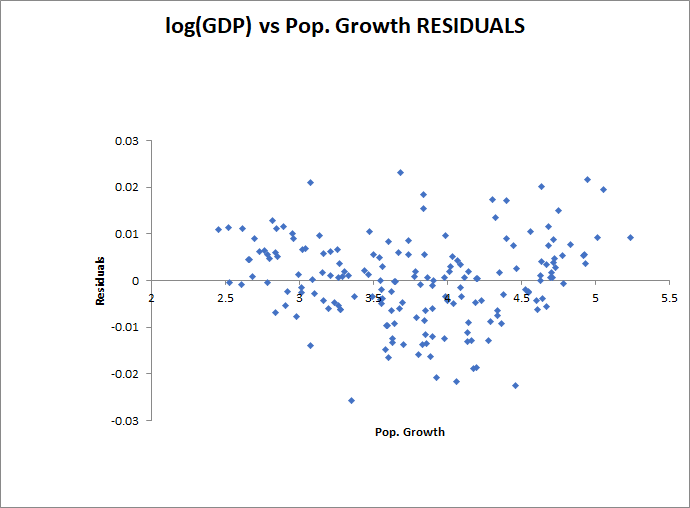
However, a look at the residual plot of the model shows that there is still some pattern that has not been extracted, and it sort of looks like a parabola, or y=x^2.
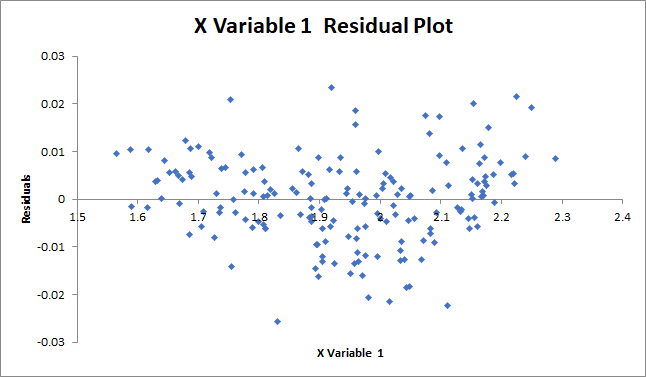
To fix this, I just took the square root of the log of the original data. This will result in a much more accurate model, allowing us to make better predictions based on the GDP of the country. As a result of this scaled data, the residuals of the new model were much more randomly scattered, and our r value was raised to .5357, which will result in a more accurate model of predictions.
Our final model based on this more accurate regression ended up being:
Population Growth (Predicted) = 0.075318765 - 0.033165897 * sqrt(log(GDP))
This allows you to get the predicted Population growth, given the GDP of a country, for example, a country with a GDP of 100,000 would have a predicted population growth of .115%.
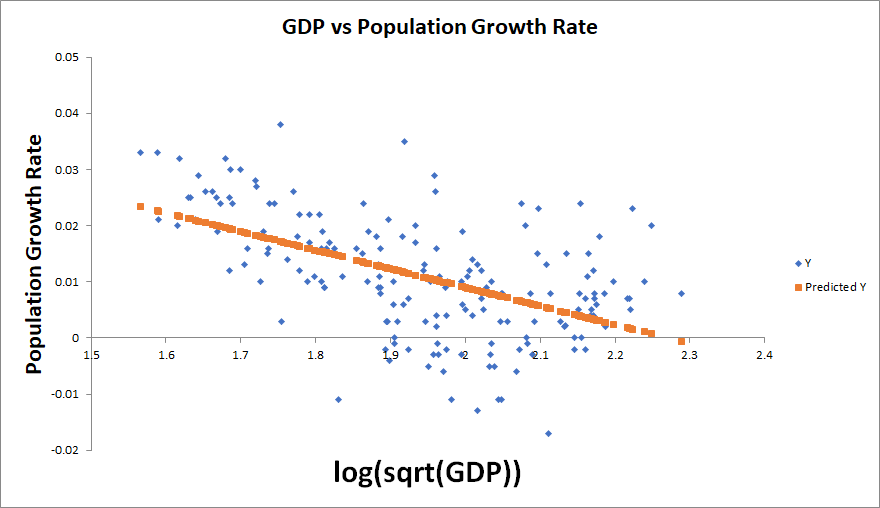
This resulted in a final scatter plot of: (Note the orange line is the predicted Population growth rates, blue dots are real values)
Population Growth (Predicted) = 0.075318765 - 0.033165897 * sqrt(log(GDP))
This allows you to get the predicted Population growth, given the GDP of a country, for example, a country with a GDP of 100,000 would have a predicted population growth of .115%.
This resulted in a final scatter plot of: (Note the orange line is the predicted Population growth rates, blue dots are real values)
Now what does this mean in terms of what a country’s GDP has to do with it’s growth rate? We came up with 4 possible explanations:
- In many poor countries, child labor is still a common practice. Families may be motivated to have more children in order to increase their total income.
- Wealthier countries have better access to birth control and other means of family planning, so their birth rates are lower.
- Wealthier countries generally provide, and wealthier individuals are generally able to access, superior educational resources. Higher levels of education are correlated with smaller families, and thus reduced population growth.
- Wealthier, more developed countries often have a lesser degree of sexual inequality, meaning that women receive more education and have more opportunities outside of traditional family roles. This results in lower birth rates as well.
Of course, the root cause of the correlation of GDP and population growth is most likely a combination of these - or many other factors that we didn't think of, but these explanations account for much of the data, and seem to explain the trend.
